


A hotel marketing report can put impressions from Meta, sessions from GA4 and bookings from the booking engine on the same page, one below the other, and each of them can be perfectly correct.
Correct still doesn’t say which question a number is answering.
I put this together to keep the numbers in a hotel marketing report in some kind of order.
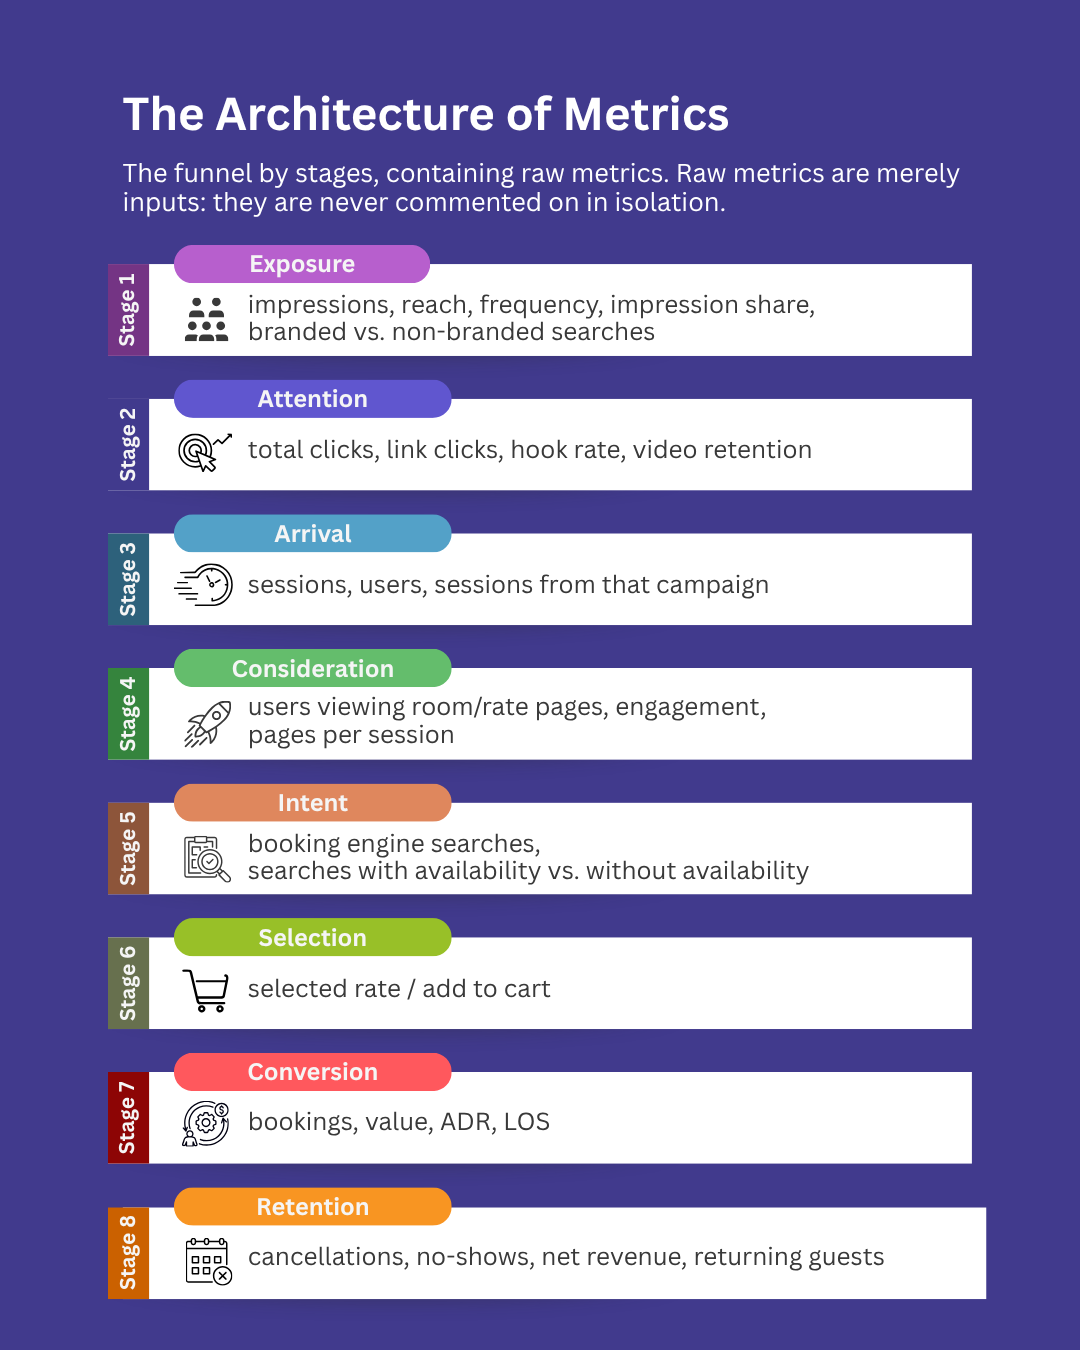
Each metric sits in the stage of the booking path it belongs to, from the first time someone sees the hotel to the guest who comes back.
On its own a number doesn’t tell me much, so I try to read it next to the stages before and after.
What follows goes through the map one stage at a time: the question each group of metrics answers, where you usually find those numbers, and the neighbouring metric I would read it with.
The examples are logic only, there’s no client data in here.
Stage 1, Exposure: does anyone see the hotel.
Impressions, reach, frequency, impression share, branded and non-branded searches.
These live in the ad platforms, Meta Ads for impressions, reach and frequency, Google Ads for impression share and for the split between searches that include the hotel name and searches that don’t.
The only question this stage answers is whether the hotel shows up in front of people, and how often.
Even inside the stage the numbers need each other, because the same impressions can come from many people seeing the ad once or from a smaller group seeing it again and again, and only reach and frequency together tell you which one you are looking at.
Then the stage needs its neighbour.
If impressions grow while clicks stay flat, the hotel was seen more and noticed proportionally less.
Being seen comes first, and the next stage asks whether anybody stopped.
Stage 2, Attention: does anybody stop.
Total clicks, link clicks, hook rate, video retention.
Still the ad platforms.
On Meta, total clicks count any interaction with the ad (the page name, the image, the “see more”), and link clicks count only the ones that lead to your site.
For video, hook rate is usually calculated from the views of the first few seconds over impressions, and retention shows how long people keep watching after that.
The neighbour I’d pick here sits one stage down: link clicks next to the sessions from that same campaign.
A link click is counted by the ad platform and a session by GA4, and in between there’s a page that has to load and a visitor who may decline cookies, so the two numbers were never going to match one to one.
When the distance between them starts growing, I would open that gap before judging the campaign.
A click says someone wanted to see more, and whether they actually got there is the next question.
Stage 3, Arrival: do they reach the site.
Sessions, users, sessions from that campaign.
This is GA4, and the Google Analytics for hotels series covers the setup behind these reports, along with a piece on which channels drive new users to your hotel website.
Sessions and users answer slightly different questions, since one person can come back and open several sessions before deciding anything.
Looking backwards, sessions from a campaign get read with the link clicks from stage 2.
Looking forwards, they get read with the visits to room and rate pages coming from that same campaign.
A campaign that brings plenty of sessions and few visits to the room pages brought people who arrived and then didn’t go on to look at what you sell.
Arriving on the site and looking at rooms and rates are two different steps, and the second one has its own stage.
Stage 4, Consideration: are they evaluating.
Users viewing room and rate pages, engagement, pages per session.
GA4 again, with the room and rate pages kept separate from the rest of the site.
Engagement and pages per session can be read both ways when they sit alone: more pages per session can be someone exploring the rooms with interest, or someone who can’t find what they came for.
The stage after helps decide which.
Put users viewing room pages next to booking engine searches, and if the first grows while the second doesn’t, the evaluation is happening without turning into a check on real dates.
Once someone types in dates, the question changes.
Stage 5, Intent: do they want specific dates.
Booking engine searches, searches with and without availability.
You find these in the booking engine reports, or in GA4 if the booking engine is tracked there, and it’s worth checking whether your target audience is actually using your booking engine in the first place.
A search with dates is someone checking a specific stay, with specific nights and usually a specific number of guests.
I read searches next to the selected rates of the following stage.
When searches go up and selected rates don’t follow, people got as far as seeing rooms and prices for their dates and then stopped before picking one.
The two numbers together can’t tell you why they stopped, though they do tell you which screen to go and look at.
On that screen the guest picks a rate, and picking has a stage of its own.
Stage 6, Selection: do they choose.
Selected rate, add to cart.
The booking engine records it, and so does GA4 when the booking engine sends ecommerce events (add_to_cart is the event name there).
How often a rate gets chosen makes more sense once you know how many times that room rate was displayed.
Forward, selected rates get read with bookings.
A guest who chose a rate and didn’t book stopped after the choice, somewhere in the steps that lead to the confirmation, guest details and payment for example.
Then the booking arrives, and the map still has two stages left.
Stage 7, Conversion: do they book.
Bookings, value, ADR, LOS.
Booking engine and PMS, plus GA4 for the booking value when purchases are tracked (more on conversion by session vs conversion by user in a separate piece).
Value is the product of rate and nights, so it can grow with the same number of bookings when stays get longer or the average rate goes up.
Before reading a higher value as more demand, I’d put it next to ADR and LOS.
The other neighbour is the last stage: bookings sit here and net revenue sits in Retention, because between the two there are cancellations and no-shows.
What survives them is the subject of the last stage.
Stage 8, Retention: what stays.
Cancellations, no-shows, net revenue, returning guests.
Mostly the PMS, with cancellations also visible in the booking engine.
A month with strong bookings and many cancellations can close with less net revenue than the bookings suggested, and you only see it by reading the two stages together.
Returning guests close the map, with the guest who comes back.
The map as a whole.
None of the eight stages is meant to be read on its own, the last one included.
Hope it helps next time a report lands on your desk.


